


Key Takeaways
- New IEEE 2020–2024 standard
- Seven KPIs of IEEE 2020–2024 Standard
- The proposed approaches for each KPIs for automotive camera evaluation
Until recently, the automotive industry lacked a common framework to accurately assess image quality parameters, given the unpredictable real-world conditions. So, to address this high importance, the IEEE 2020–2024 Working Group developed a dedicated standard that provides structured test methods for evaluating the image quality.
In this blog, you’ll learn extensively about the IEEE 2020–2024 standard and its KPIs for automotive camera evaluation.
What Is IEEE 2020–2024 Standard?
The IEEE 2020–2024 standard is a universal measurement for evaluating the image quality of automotive cameras. This establishes a universal reference point to validate the image quality of automotive cameras. It builds consistent quality expectations, reduces subjective interpretation, and streamlines communication throughout the automotive imaging field.
At e-con Systems, we follow this IEEE 2020–2024 standard for measuring automotive image quality.
What Are the 7 key performance indicators (KPIs) of the IEEE 2020–2024 Standard?
There are seven fundamental image quality parameters included in the IEEE 2020–2024 standard to assess image quality in automotive cameras. They are:
- Flare
- Noise
- Dynamic range
- Spatial Frequency Response (SFR)
- Flicker
- Contrast performance indicator
- Geometric calibration validation
Let’s look at each attribute of the automotive imaging quality and how it can be measured to achieve a high-quality image in the automotive camera.
1) Flare
Any light reaching the sensor other than through the designed optical path, i.e., lens, is called flare, also known as stray light. This locally boosts the signal and induces contrast difference, thereby affecting critical parameters such as dynamic range, SNR, and so on.
The ghosting flare and veiling flare, as you can see in the image below, can be measured using either the ISO 18844 Test Chart, a transmissive test chart with black dots or light traps on a white background, or a collimated light source along with the camera to be tested in a dark environment.
 |
 |
Figure 1: Ghosting Flare (Left) and Veiling Flare (Right)
2) Noise
The incoming light is the signal that one wants to capture and store, but inaccuracies, that is, random variation in the information, constitute noise. Noise is categorized into many types based on its source, such as temperature, sensor readout, pixel non-uniformity, and so on.
It is an important parameter that causes degradation in image quality if not addressed and contributes to SNR, dynamic range, and sharpness of the imaging system.
In the below image, you can see the lines and random variation in the pixel intensity, which is predominant in the low light conditions where the signal is weaker .
 |
 |
Figure 2: Noisy Image (Left) and Without Noise (Right)
When measuring noise, all auto-control blocks, such as AE, the AWB should be disabled. If gain and integration time can be adjusted, they should be set to values within the allowed range for the intended application; otherwise, default values should be used. It is recommended to perform dark statistics and SNR measurements when defect-pixel corrections are enabled and disabled. Image data in companded format shall be decompanded before analysis. The input data format is RAW.
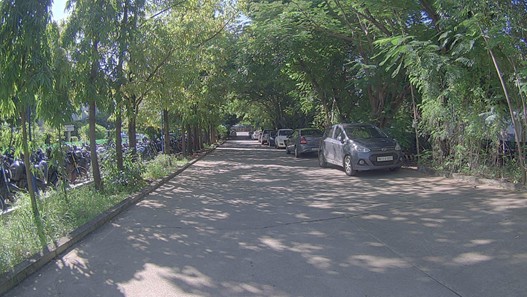
3) Dynamic range
The range of maximum and minimum luminance or brightness that an imaging system can replicate with a high Signal-to-Noise Ratio (SNR) and strong contrast is known as dynamic range. It is crucial in automotive applications that operate in outdoor environments, as details in both bright and dark regions are necessary.
The image below illustrates the camera’s image in normal mode and HDR mode.
 |
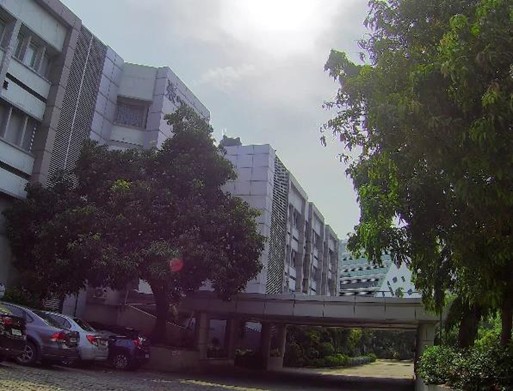 |
Figure 3: Normal Mode (Left) and HDR Mode (Right)
Contrast-to-Noise Ratio (CNR) and Total Contrast Gain (TCG) are the two key bounding metrics used to evaluate a camera’s dynamic range.
Contrast-to-Noise Ratio (CNR)
CNR is the Ratio of signal difference and noise. It quantifies how clearly a subject can be distinguished from its background in the presence of noise.
- There is no need for preprocessing if the camera output is linear.
- If the image output is companded, it must be decompanded before analysis.
- If the image is gamma-encoded, gamma decoding should be performed to convert it to a linear format.
Total Contrast Gain (TCG)
TCG measures the camera’s ability to transfer contrast accurately across local flat regions of the scene. If the output is gamma-encoded, preprocessing steps such as display gamma correction and compensation for display leakage or reflection offset should be applied.
By calculating both CNR and TCG, the camera’s dynamic range can be determined.
4) Spatial Frequency Response
Sharpness is a metric used to quantify the system’s capacity to resolve a detail and the calibre of collected information. When reading signs and texts outside, it is essential.
In the image below, you can see a comparison of the images with respect to sharpness.
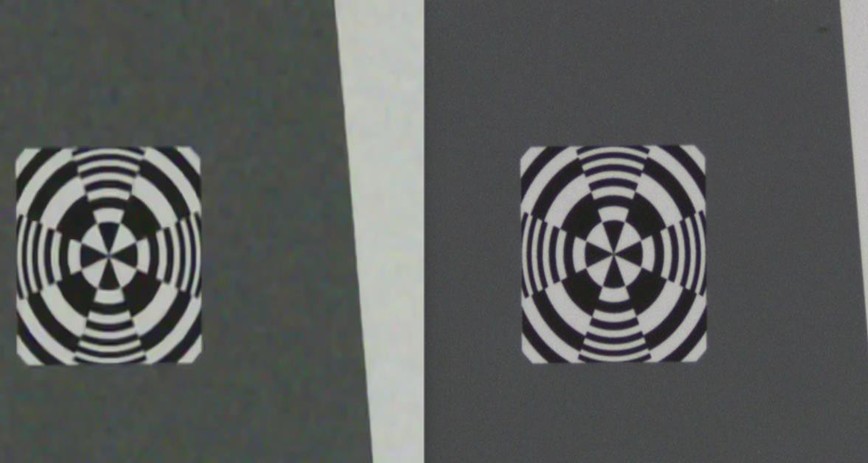 |
Figure 4: Blurred Image (Left) and Sharp Image (Right)
The image on the right has edges and centre features more finely resolved, whereas the left one has smoothed the details.
The procedure for measuring Spatial Frequency Response (SFR) follows the guidelines outlined in ISO 12233. The measurement should be conducted under controlled lighting conditions. The target test chart must be uniformly illuminated, with a uniformity greater than 90% across the entire chart and greater than 97% within the smaller Region of Interest (ROI).
5) Flicker
Many LEDs use PWM to adjust brightness, and this involves rapid on and off. It is so high that our eyes can’t perceive its flickering. However, image sensors in the camera are exposed for a certain time, and when this exposure time is lower than the flicker time of the LEDs, it causes flicker.
The image below illustrates how LED pulsing and camera exposure timing can result in missed traffic signal capture in consecutive frames.
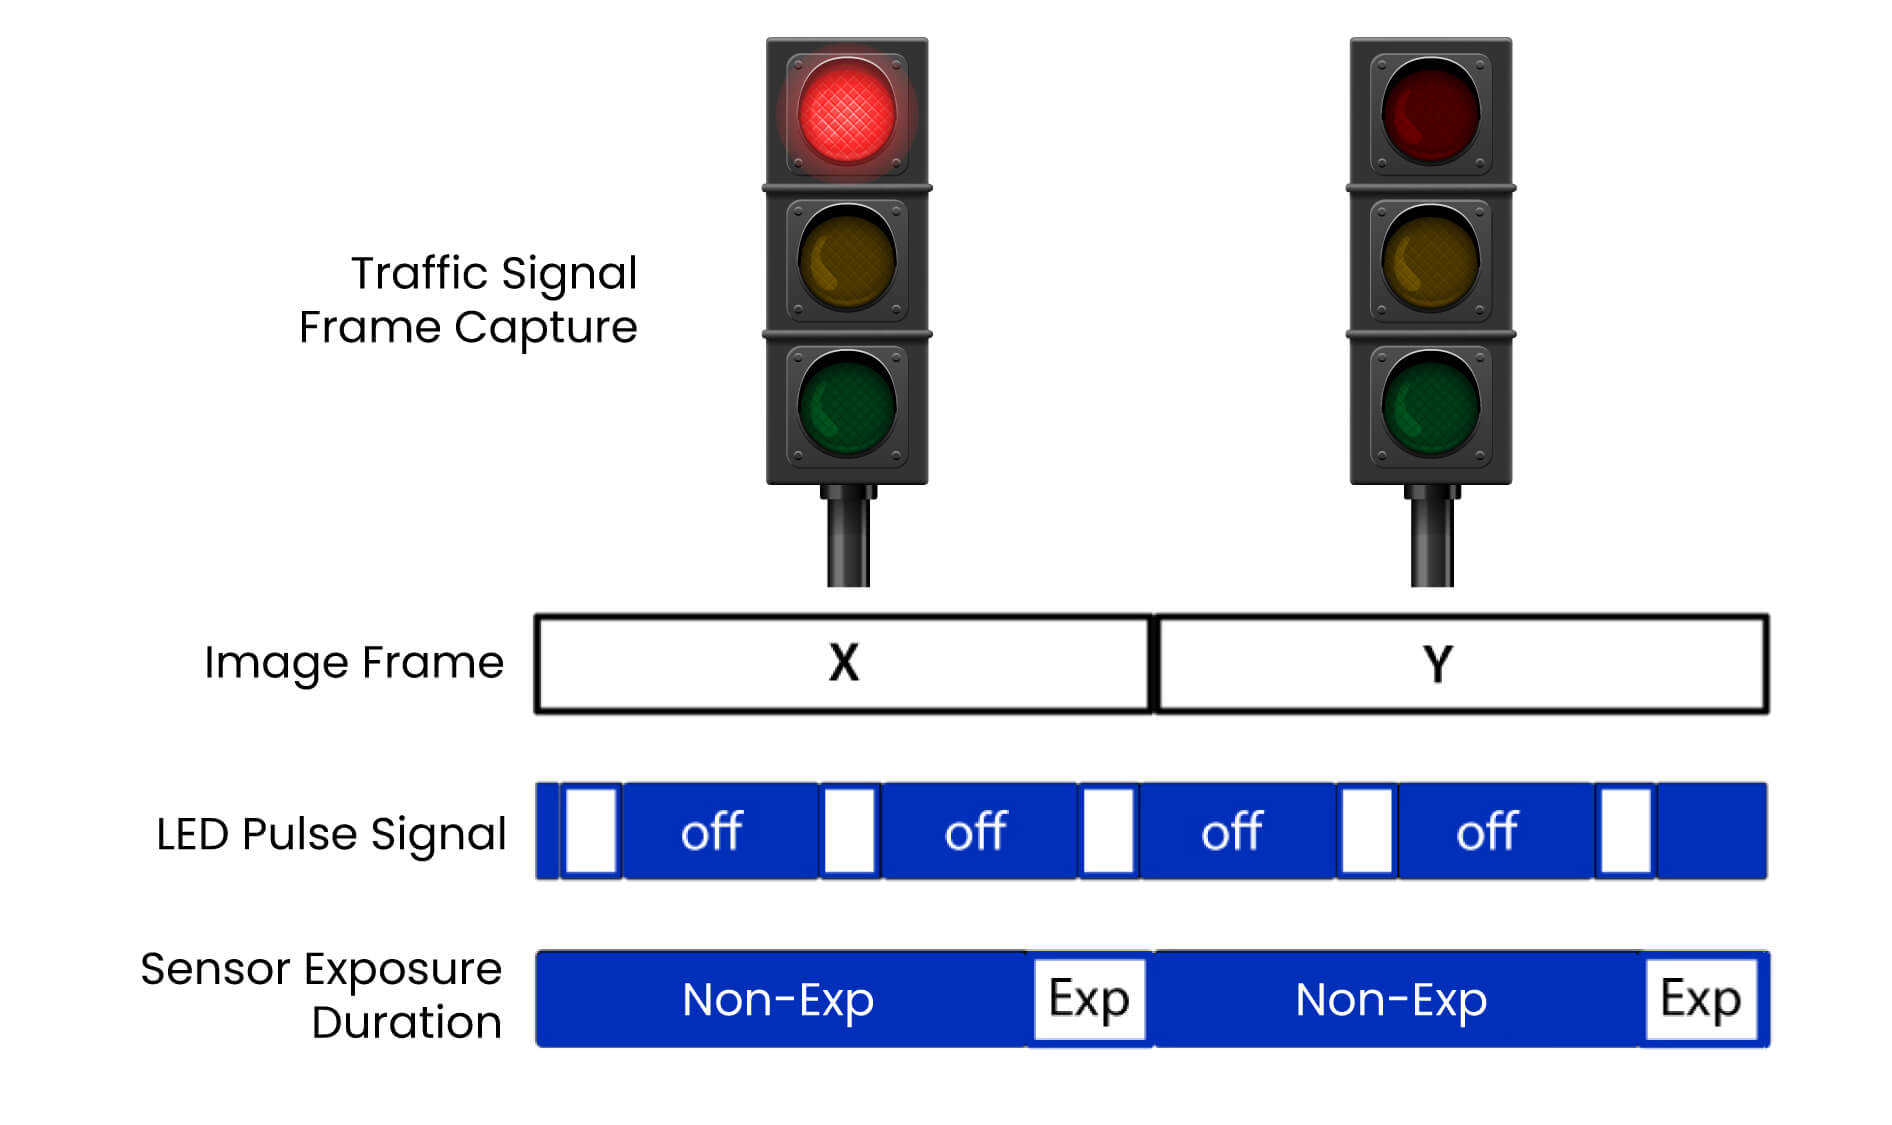 |
Figure 5: Timing Diagram of LED Pulsing and Camera Exposure Timing
The LED pulse aligns with the camera’s exposure time, allowing the light to be captured in the x frame. In frame y, the LED pulse does not overlap with the exposure time, resulting in the light appearing off.
In the image below, the output image of the camera without LFM and the output image of the camera with the LED Flicker Mitigation (LFM) feature.
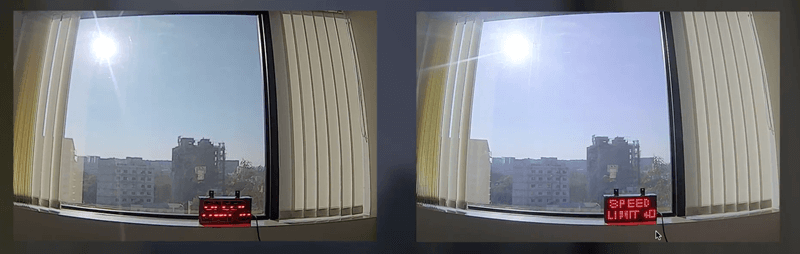 |
Figure 6: Camera Output Image without LFM (Left) and with LFM (Right)
The camera with LED Flicker Mitigation (LFM) features accurately captures the LED light source without LED flicker.
The uniform neutral background, background illumination light sources, baffles, and PWM-driven LED light sources are needed to measure the flicker in the automotive camera.
6) Contrast performance indicator
Luminance contrast is defined as the relationship between a bright area and an adjacent dark area, and its measurement is subject to multiple parameters. The embedded camera must detect such differences to be able to provide better image quality performance and information.
Many factors contribute to identifying such differences, and factors such as flare and improper tone mapping can cause adverse effects on it.
The image below illustrates the loss in contrast.
 |
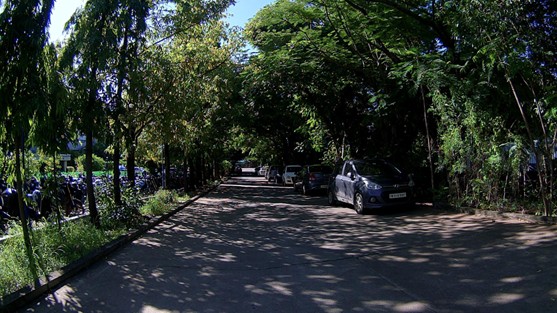 |
Figure 7: Low Contrast (Left) and Good Contrast (Right)
The light from the bright regions affects the adjacent areas of the scene, which are ideally less intense than the former.
The contrast evaluation is performed by exposing the device under test to a group of patches of known luminance and calculating contrast metrics from combinations of readings from the recorded patches. The contrast evaluation is performed by a test chart.
Contrast transfer accuracy (CTA) and Contrast signal-to-noise ratio (CSNR) are the key metrics of the Contrast performance indicator used to evaluate the image quality of the automotive camera. By analyzing these values, the overall contrast performance can be assessed.
- The probability that a scene’s contrast will be accurately reproduced within predetermined limitations under specific imaging settings is determined by contrast transfer accuracy (CTA).
- Contrast signal-to-noise ratio (CSNR) estimates the quality of signal separation by comparing the mean contrast to its standard deviation under given imaging conditions.
7) Geometric calibration validation
Geometric calibration is the process of determining and correcting geometric distortion or inaccuracies in a camera so that the captured data accurately reflects the real-world spatial layout, including position, size, and other relevant characteristics.
Geometric calibration validation ensures accurate mapping between real-world coordinates and detected image points.
Geometric calibration test exercise
Intrinsic calibration: Estimates the focal length, principal point, skew, and distortion coefficients using calibration patterns (e.g., checkerboards).
Extrinsic calibration: Determines the camera’s position and orientation with respect to a reference coordinate system.
While the above key metrics focus on validation within the image space for individual cameras, multi-camera systems require an additional layer of calibration—geometric alignment across multiple viewpoints. In such systems, the coordination and mapping between different camera angles are essential for constructing a consistent spatial understanding of the environment.
To achieve this, multi-camera calibration integrates both intrinsic (individual camera parameters like focal length and distortion) and extrinsic (relative position and orientation between cameras) calibrations. This combined calibration ensures that all cameras operate in a synchronized and geometrically consistent manner, enabling reliable depth perception, object detection, and scene understanding across the system.
To evaluate geometric calibration, a stable camera mount, uniform lighting (such as flicker-free LED or panels), and common charts (such as checkerboards, dot patterns, or 3D markers) are required.
Validation Process of Geometric Calibration
The reprojection error analysis should be performed on the automotive camera to ensure the geometric accuracy of the camera’s image. The residual error between observed image points and reprojected points from 3D calibration objects is used as a metric for validation.
According to the standard, the accuracy targets should be within limits (e.g., max RMS reprojection error, percentage of points exceeding thresholds).
Test charts and patterns, such as known 3D patterns (e.g., checkerboards or dot grids), can be used across the field of view to verify accuracy.
econ Systems Offers High-Quality Automotive Cameras
Since 2003, e-con Systems has been designing, developing, and manufacturing embedded vision cameras. Our deep expertise in camera technology allows us to thoroughly evaluate and enhance image quality at every stage of the camera development process. By combining industry standards like IEEE 2020–2024 with in-house testing methodologies, we ensure that our cameras consistently deliver high performance for mission-critical applications.
We also offer a range of cutting-edge automotive cameras that include:
- Patented hot-pluggable GMSL support
- High Dynamic Range (up to 150dB)
- Superior low-light performance
- Global shutter
- LFM
- IP69K-rated enclosures
Use our Camera Selector to view our end-to-end portfolio.
Need help finding the best-fit automotive camera that meets the right standards? Please contact us at camerasolutions@e-consystems.com.

Prabu is the Chief Technology Officer and Head of Camera Products at e-con Systems, and comes with a rich experience of more than 15 years in the embedded vision space. He brings to the table a deep knowledge in USB cameras, embedded vision cameras, vision algorithms and FPGAs. He has built 50+ camera solutions spanning various domains such as medical, industrial, agriculture, retail, biometrics, and more. He also comes with expertise in device driver development and BSP development. Currently, Prabu’s focus is to build smart camera solutions that power new age AI based applications.