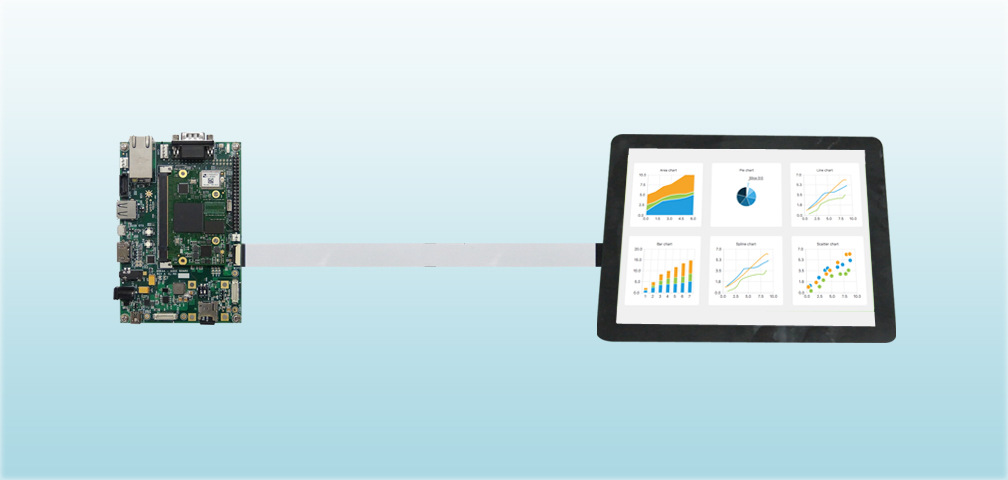
Qt commercial charts is an add-on module provided by Qt with which various chart components can be incorporated into the Qt applications. The chart components can be used as Qwidget and QGraphicsWidget object or QML type.
Qt commercial charts provide APIs for the following types of charts:
- Line and Spline charts
- Area and Scatter charts
- Bar charts
- Pie charts
- Box and whiskers chart
- Candlestick chart
- Polar chart
The following axis types are supported by the QCharts
- Value axis
- Category axis
- Bar category axis
- Date-Time axis
- Logarithmic axis
QCharts can be bound to the following ways to the application
QLineSeries *lineSeries = new QLineSeries();
lineSeries->add(0, 9);
lineSeries->add(1, 3);
view->chart()->addSeries(lineSeries);
view->chart()->createDefaultAxes();
QCharts can also be added to the QML as shown below:
import QtQuick 2.0
import QtCharts 2.0ChartView {
width: 640
height: 480
antialiasing: true
PieSeries {
id: pieSeries
PieSlice {
label: “Success”
value: 94.9
}
PieSlice {
label: “Failure”
value: 5.1
}
}
}
Please visit our developer website to know get step by step instructions to setup toolchain with Qt on our eSOMiMX6 board.
For further assistance and queries get in touch with sales@e-consystems.com
Try eSOM++ Qt Charts on eSOMiMX6