Qt’s binding with JavaScript is well-known to the world. You can do just amazing things with this binding. One such wonder is Graphs.
Data visualization is a common method to visually illustrate relationships in the data. The purpose of data visualization is to present data that are too numerous or complicated to be described adequately in the text and in less space.
As a human, we would be pleased to view that graphical data in a qualitative visual form. This can be done with QML which provides fluid animations and visually appealing components.
This article will explain how JavaScript chart can be bound with QML to produce an appealing data visualization application for eSOMiMX6.
The Chart.js is the heart of the application. It contains the default properties of each graph, initialization code, code for drawing the graph/chart and the mathematical functions for frequently used calculations.
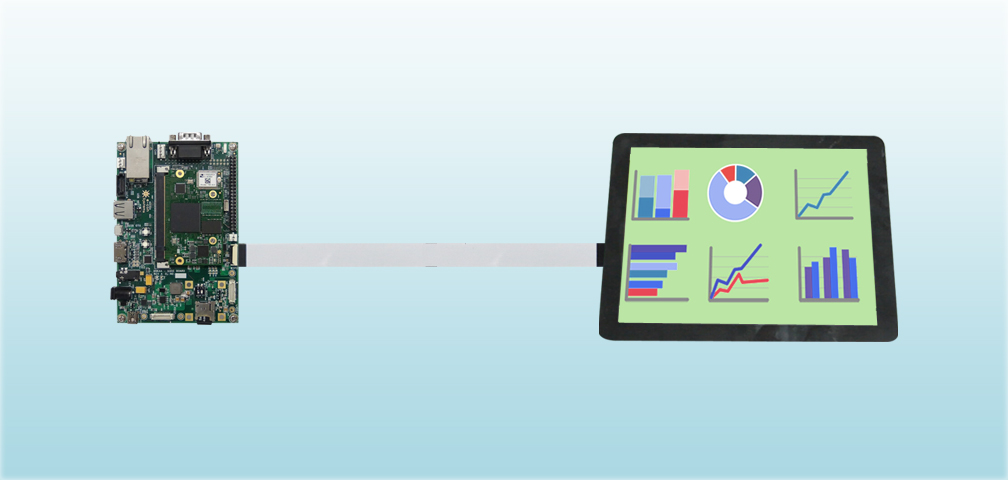
The application depicts the following graphs:
- Bar graph
- Line graph
- Pie graph
- Doughnut graph
- Polar graph
- Radar graph
Full source code for the binding js with QML with graph sample application is available on our developer site.
Please refer our previous articles on How to setup Qt creator for eSOMiMX6 devices and How to build, deploy and run Qt applications on eSOMiMX6 devices to build and run the application on eSOMiMX6 devices.
For further assistance and queries get in touch with sales@e-consystems.com
Qt-QML-Build-Deploy-Run-Steps Application Guide
Qt Basics Samples Package Containing Graphs