Most visually pleasing and complex charts that one can find on the internet are done using HTML5.
This article guides you to quickly enable and run HTML5 charts on e-con Systems™ eSOMiMX6 based development kit Ankaa using Qt.
We have included free samples which you can download for free by just registering yourself on our developer website.
To showcase how quickly we can plug a HTML5 chart into a Qt application we performed the following steps:
-
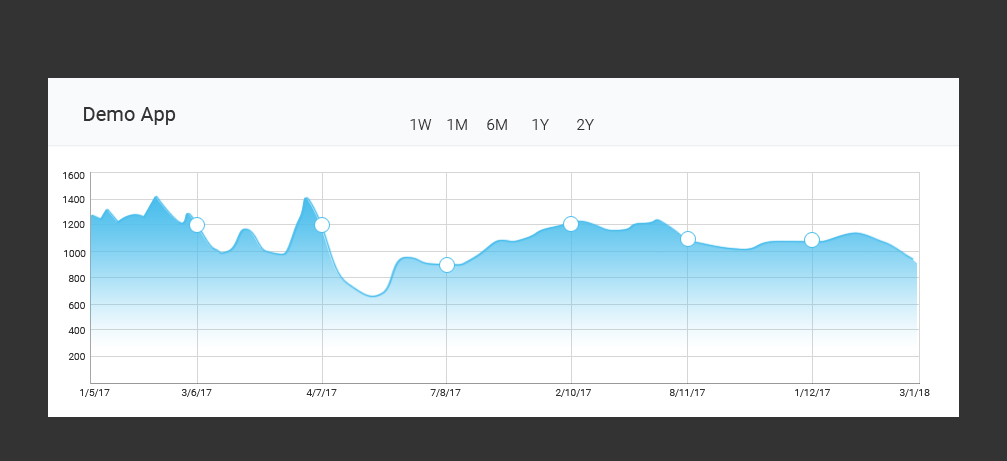
Developed a HTML5 chart using Zingchart. Zingchart is a declarative, efficient, and simple JavaScript library for building responsive charts with integrations in Angular, React, JQuery, PHP, Ember, & Backbone.
-
Developed a QML application using QWebEngine.The Qt WebEngine module provides a web browser engine that makes it easy to embed content from the World Wide Web into your Qt application.
-
Passed the URL of the HTML file to the WebEngineView QML type. WebEngineView allows Qt Quick applications to render regions of dynamic web content.
The result are amazing!! The time taken to develop, build, deploy and run the application eSOMiMX6 was less than 30 minutes. The output was a HTML5 chart with an excellent look and feel on our eSOMiMX6 device.
The below code is used to load the HTML5 chart in the QML window.
import QtWebEngine 1.0
Window
{
width: 1024
height: 750
visible: true
WebEngineView
{
anchors.fill: parent
url: “chart.html” //Give the url of HTML page
}
}
Please refer our previous articles on How to setup Qt creator for eSOMiMX6 devices and How to build, deploy and run Qt applications on eSOMiIMX6 devices to build and run the application on eSOMiMX6 devices.